Note2
Monitoring is an exercise to measure ambient levels of air pollution in an area. The results of which indicate the status of quality of air we breathe. Monitoring data, over a long term, is especially useful as it allows us to tease out patterns that help support air pollution control policy. These patterns include, spatial differences in pollution (which areas of the city are more polluted) and temporal differences (is there a pattern of pollution levels during a day and/or a year). So, while air pollution monitoring itself does not reduce air pollution, it gives us clues as to where the pollution is coming from and what is its level. By providing a baseline, we also know if our efforts for improving the quality of air are bearing fruit or if we need to try other options or be more aggressive in our current efforts.
It is because monitoring informs air pollution policy, that it is often cited as an integral part (if not the key measure) of a pollution control strategy by policy makers, and by extension, the media. For example, here is an article from 2016 in the Hindustan Times that quotes, “The mobile air quality monitoring unit will be capable of real-time sampling, analysis and control of air pollution from sources..”. This statement can be misleading, as it could be read that the mobile unit will make rounds of the city and “control” air pollution by sucking up pollution.
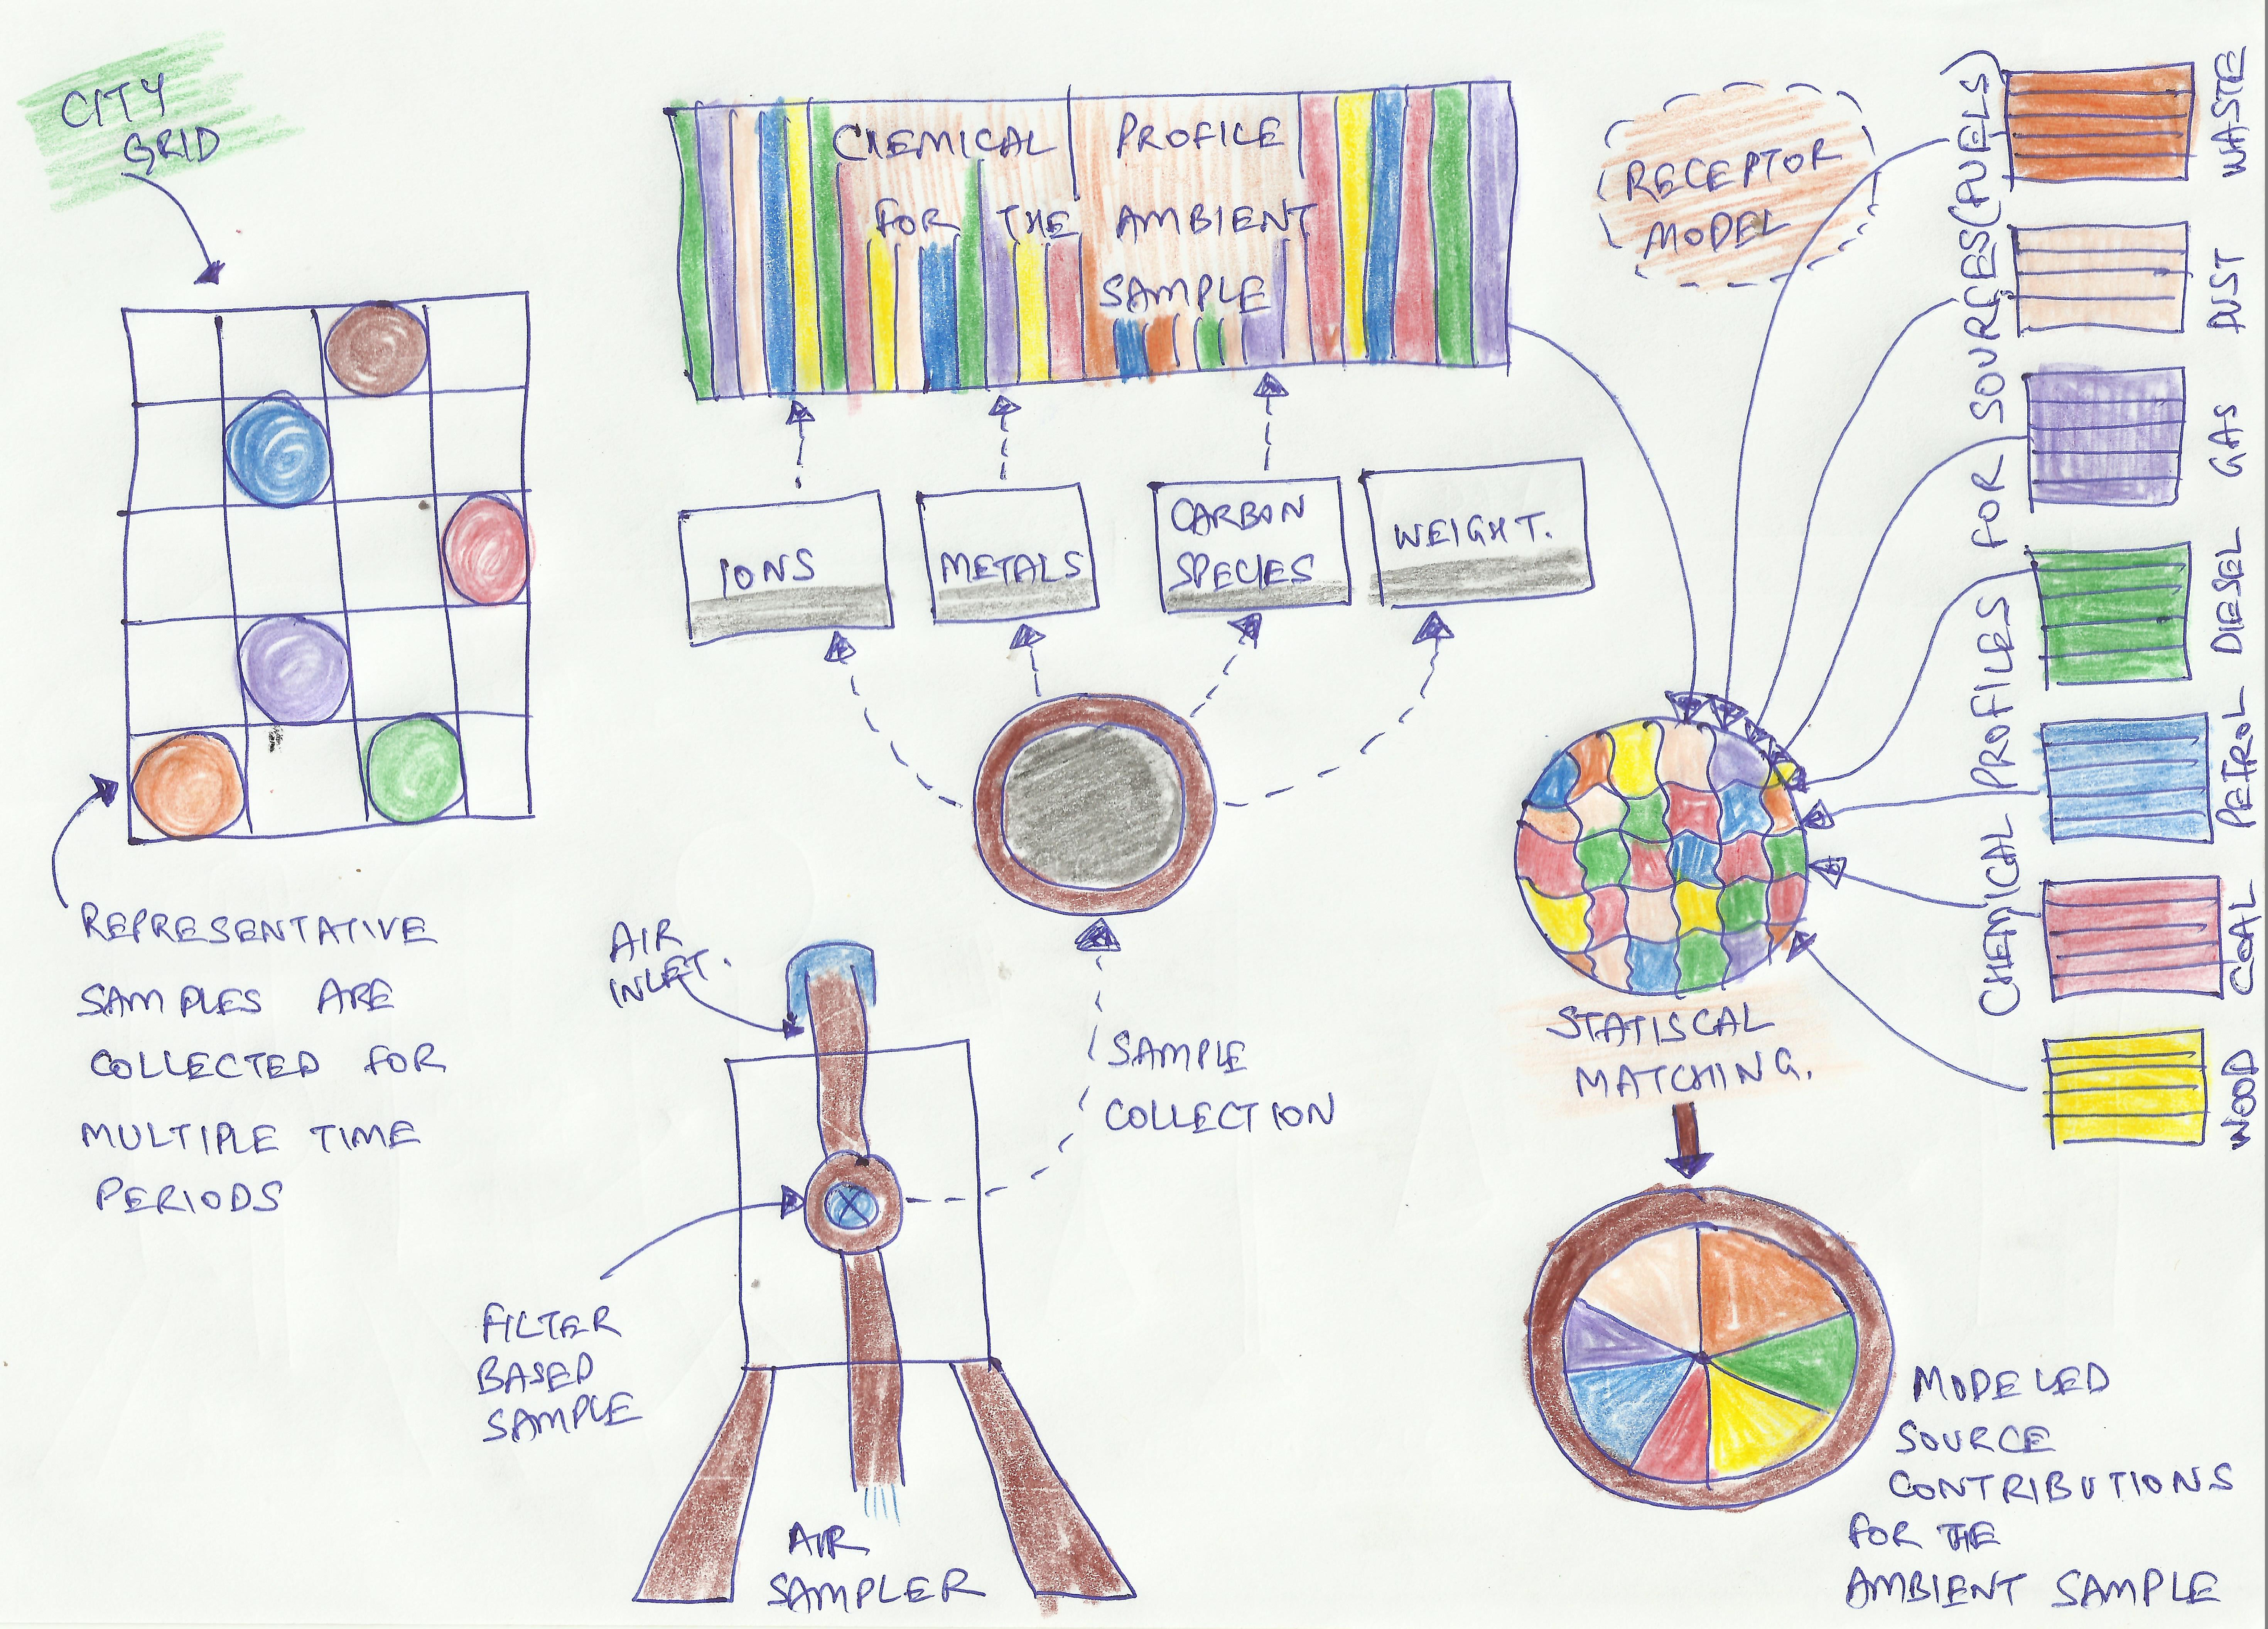
The filter based pollution samples can be chemically analyzed to determine contributing sources (for more on the methods, see the primer on source apportionment). The chemical analysis allows us to estimate how much of the pollution is a result of various fuels such as petrol, diesel, coal, biomass, waste, or dust, which can be statistically matched to ascertain the source contributions such as vehicular traffic, crop burning, power plants, industries, household cooking and heating, and so on.
 Armed with this information, we can then control the level of pollutants in the air by reducing emissions at those sources – vehicle tail pipes, dust on the roads, construction sites, diesel generator sets, industries small and large, domestic and commercial cooking, space heating, water heating, open waste burning, and open biomass burning. Hence monitoring can be compared to a diagnostic tool that informs the course of action (the treatment) carried out through policy and implementation.
Note1
Monitoring is an exercise to measure ambient levels of air pollution in an area. The results of which indicate the status of quality of air we breathe. Monitoring data, over a long term, is especially useful as it allows us to tease out patterns that help support air pollution control policy. These patterns include, spatial differences in pollution (which areas of the city are more polluted) and temporal differences (is there a pattern of pollution levels during a day and/or a year). So, while air pollution monitoring itself does not reduce air pollution, it gives us clues as to where the pollution is coming from and what is its level. By providing a baseline, we also know if our efforts for improving the quality of air are bearing fruit or if we need to try other options or be more aggressive in our current efforts.
It is because monitoring informs air pollution policy, that it is often cited as an integral part (if not the key measure) of a pollution control strategy by policy makers, and by extension, the media. For example, here is an article from 2016 in the Hindustan Times that quotes, “The mobile air quality monitoring unit will be capable of real-time sampling, analysis and control of air pollution from sources..”. This statement can be misleading, as it could be read that the mobile unit will make rounds of the city and “control” air pollution by sucking up pollution.
The filter based pollution samples can be chemically analyzed to determine contributing sources (for more on the methods, see the primer on source apportionment). The chemical analysis allows us to estimate how much of the pollution is a result of various fuels such as petrol, diesel, coal, biomass, waste, or dust, which can be statistically matched to ascertain the source contributions such as vehicular traffic, crop burning, power plants, industries, household cooking and heating, and so on.
 Armed with this information, we can then control the level of pollutants in the air by reducing emissions at those sources – vehicle tail pipes, dust on the roads, construction sites, diesel generator sets, industries small and large, domestic and commercial cooking, space heating, water heating, open waste burning, and open biomass burning. Hence monitoring can be compared to a diagnostic tool that informs the course of action (the treatment) carried out through policy and implementation.
