March, 2016: Air pollution in (urban and rural) India is a growing public concern, and city of Delhi (its capital) is one of the most studied city with a disproportionate share of media attention. Yet, we do not seem to have decisive answers to simple questions like how polluted is the city, what are the main sources, and where to start to control pollution in the city. An earlier post focused on a “call for open air pollution data” in Delhi and other Indian cities. Some opinion pieces published online are the following
How do we improve Delhi’s graded responsibility action plan for better air quality
Op-Ed in the WIRE (2017)
A sense of Déjà Vu – How Delhi knew what to do to fix its air pollution in 1997
Op-Ed in the WIRE (2017)
What it means to taking the long view on air pollution in Delhi
Op-Ed in the WIRE (2016)
Why Delhi’s plan for air filters at traffic intersections is a red herring
Op-Ed in the WIRE (2016)
Is banning old vehicles enough to control air pollution in Delhi?
Commentary article in India Together (2014)
What will it take to make Indian cities environment smart?
Commentary article in India Together (2015)
This post is an attempt to put some information into perspective to illuminate one perpetual question, what are the sources of air pollution in Delhi? This is the most commonly asked question and also the most confusing and unanswered. Before we start pointing fingers at various sources and laying down numbers, there are some basics that we need to understand. I will try my best to make it as non-scientific as possible. Then, we will jump into the blame games.
BASICS 001 – there are many pollutants
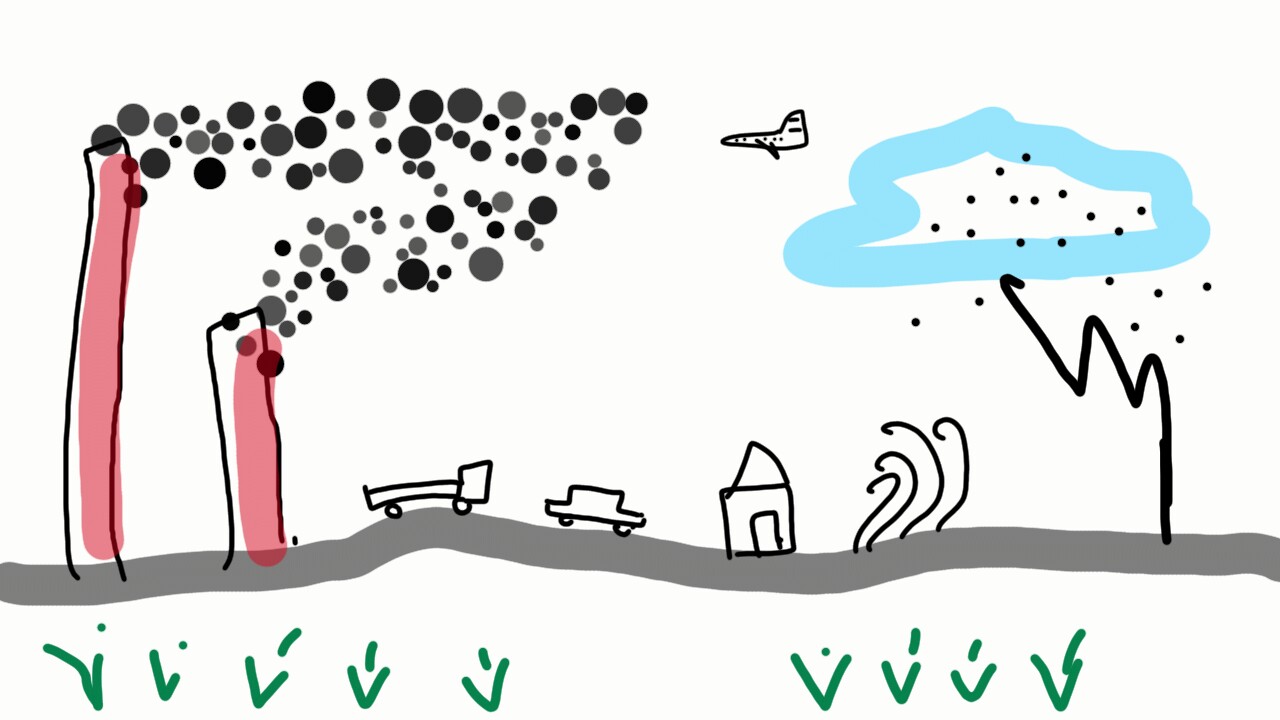
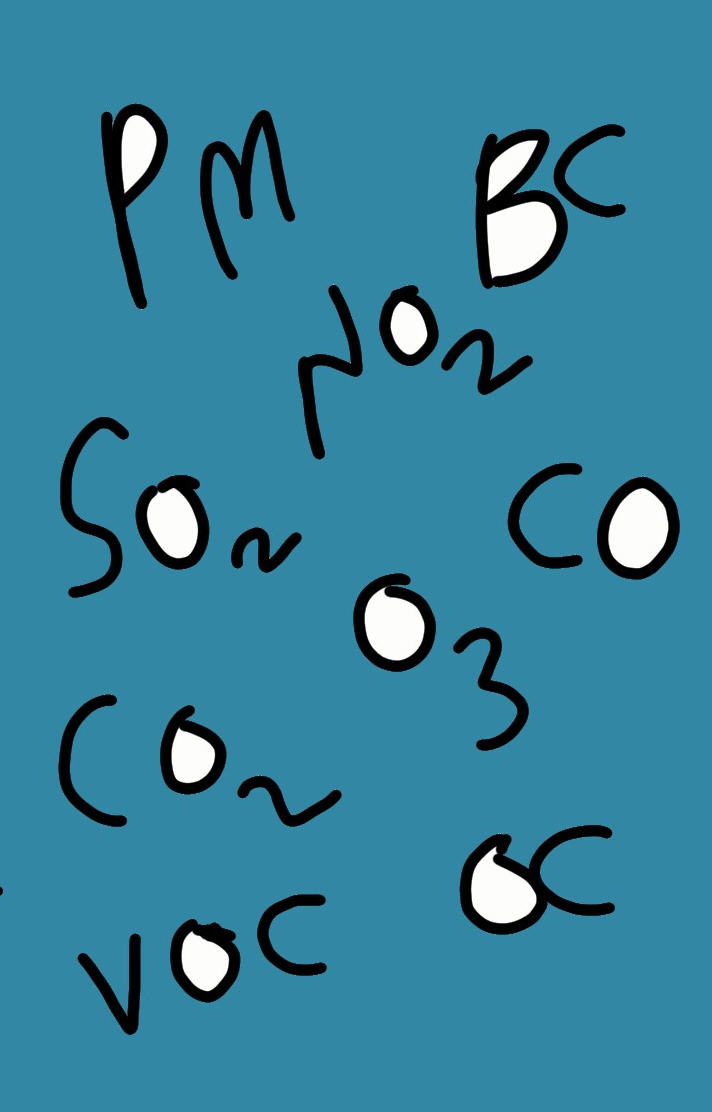 Critical pollutants are particulate matter (PM), nitrogen oxides (NOx), sulfur dioxide (SO2), carbon monoxide (CO), and ozone (O3). We should never discuss them all at once, because they are very different in their chemical nature and different in the ways they affect our health. And on the other side, we have the greenhouse gases like carbon dioxide (CO2), which also has an impact on health, but more decisively linked to climate change. Only thing they have in common is that all the pollutants originate from the same sources – anything burnt will produce at least one of these pollutants or all of them (an extension to this is that if you implement controls for one pollutant, you are likely to control other pollutants as well, which is commonly referred to as co-benefits). Sources also contribute differently to these pollutants, meaning a source attribution based on NOx emissions is not the same as a source attribution based on PM or CO2. So, of these, if we have to pick one pollutant that is super critical for human health, then it is PM. Sometimes, this is also referred as dust, aerosols, and soot.
The PM size under 2.5μm diameter is the most known harmful and measurable fraction, referred to as PM2.5. Its chemical composition has contributions from all the other gaseous components, such as, SO2 shows up as sulfate aerosols, NOx shows up as nitrate aerosols, volatile organic compounds (VOCs) after undergoing a series of chemical reactions with ozone, NOx, and CO, to show up as secondary organic aerosols (SOA).
 In simple language, focusing our efforts on PM2.5 to identify urban pollution sources will be enough to address overall urban air quality scenario in Delhi, without mixing messages and discussing everything under the sun.
BASICS 002 – PM10 and PM2.5 are very different
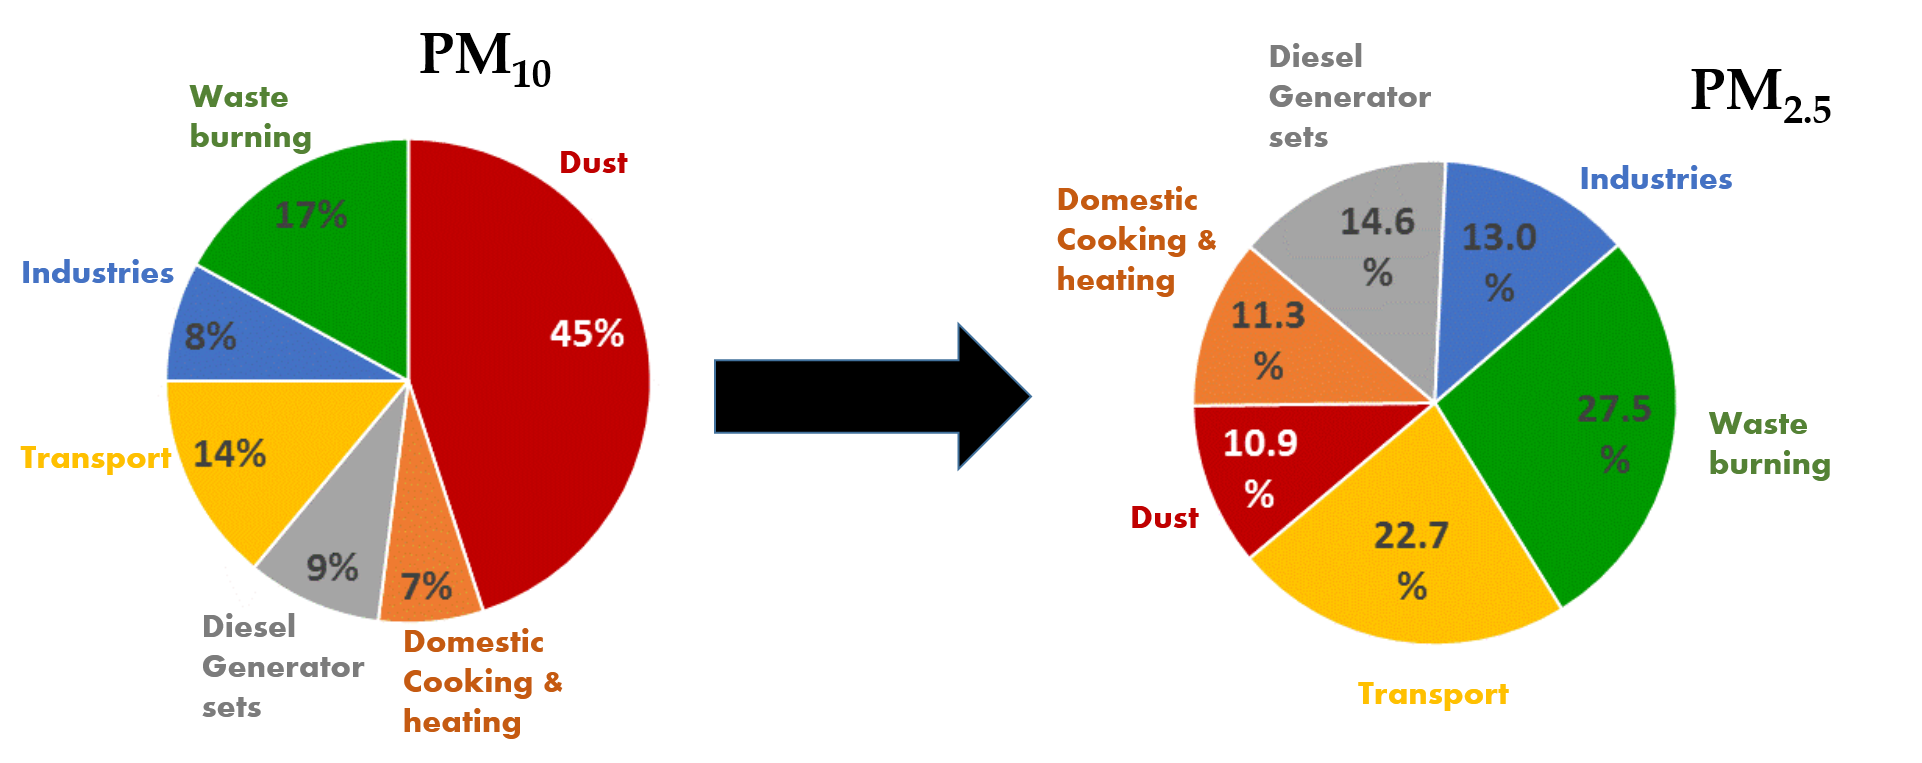
 PM10 is all aerosols under 10μm diameter; PM2.5 all aerosols under 2.5μm diameter. PM2.5 is a subset of PM10 and the ratio varies from city to city and source to source. In India, the source apportionment studies conducted using PM2.5 and PM10 will result in different contribution charts.
Most of the PM2.5 pollution is combustion based. For example, more than 95% of emissions from diesel, petrol, and natural gas combustion falls under PM2.5; most of the open waste burning pollution, biomass burning pollution, and coal combustion at boilers, falls under PM2.5.
However, a good fraction of PM10 comes from mechanical processes – like dust, on the roads due to the constant vehicular movement, at the construction sites, and the seasonal dust storms. Close to 80% of the dust (that we commonly find on the roads) falls into the size fraction between PM2.5 and PM10. This be the main reason for finding more dust in a PM10 sample and little dust in a PM2.5 sample.
PM10 was, for the longest time, the only size fraction measured in India. PM2.5 was added to the list of criteria pollutants in 2009, and now measured in 20+ Indian cities using continuous monitoring stations. A summary of monitoring data for the last 8 days, from official and unofficial networks in various Indian cities, is hosted here.
BASICS 003 – emission inventory is not pollution source attribution
 Emissions is what comes out of the vehicle tail pipes, chimneys at the huts, industries, and power plants, trash burning, and the re-suspension of dust. This is commonly measured and reported as grams of pollutant emitted per km of vehicle travel, grams of pollutant emitted per kilo of fuel burnt, or sometimes grams of pollutant emitted per hour (mass over time).
Pollution, on the other hand, is what we breathe and it is measured and reported as μg/m3 (mass over volume). After the pollutants are free of their source, in other words, all the emissions are in the atmosphere, they get mixed, moved, and mangled, and end up as pollution. The net pollution that we measure at the monitoring stations is due to all emissions or sometimes every bit of the pollution could be a non-local emission source (examples to follow).
A source apportionment study based on emissions inventory and a study based on pollution samples, will result in different contribution charts. What we are most interested in is the second one – which sources are contributing to the pollution we are breathing?
A primer on pollution source apportionment Download
BASICS 004 – diffused vs. point and local vs. non-local sources
 The ground level sources like vehicle exhaust, re-suspended dust, open waste burning, residential cooking and heating, are commonly referred to as diffused sources, tend to influence the immediate vicinity and then they diffuse and disperse into the neighborhoods. And the others like industries and power plants with high stacks, their emissions have the tendency to move farther distances (depending on local meteorological conditions) and end up as pollution not only where they are sourced, but also away.
So, in numbers, if we are looking at an emissions inventory for a city; it is possible the city may have only the diffused sources in its administrative boundary. For example, in case of Delhi, all the coal-fired thermal power plants are outside Delhi (within 20-30 km), all the brick kilns are outside Delhi, a majority of the industries are outside Delhi, which means an emissions inventory drawn from within the administrative boundary of the city, will miss the pollution we are eventually breathing. Another example, every November, we point fingers at the crop residue burning in Punjab and Haryana and its immediate impact of Delhi’s urban air quality. Is this part of a regular emissions inventory for Delhi – NO. However, it is part of the pollution that we are breathing, because of long range transport.
BASICS 005 – working domain size
 What is the area covered for the emissions inventory calculations? This varies with the group conducting the study; and consequently the results. Often this is the administrative boundary, because the city authorities like it that way. So, it is not fair to compare the emission inventory studies from different groups, unless, the studies are for the same working domain.
It is our opinion that an area of 80 km x 80 km with the Delhi metropolitan authority in the center, is a good working domain for the Greater Delhi region, which will cover all the known sources of pollution, which can potentially influence Delhi’s air quality – power plants, brick kilns, and industries, besides the usual suspects – vehicle exhaust, road dust, cooking and heating, open waste burning, and diesel generator sets.
On the other hand, ambient sampling based pollution attribution doesn’t have this restriction, because the analysis starts with what is in the atmosphere (sampling), followed by the analysis of the samples for chemical markers, and statistically matched source apportionment.
BASICS 006 – city is not just roads
If all the measurements and modeling work was conducted around roads, then yes, all the pollution measured and modeled will be from vehicle exhaust and road dust. However, we have to keep in mind that roads are only part of the urban infrastructure and simultaneously, there are hundreds of other activities underway. For Delhi, roads account for less than 20% of the urban land, with the rest covered with residential, industrial, natural, and recreational activities.
What are we looking for?
If the goal is to find out what is polluting Delhi, then stop looking at the emission inventories and start looking at the pollution based source attribution. The emission inventories give you an idea of the sources. If the mix of sources is not that diverse, it is possible that the attributions we find in the emissions will be similar to those we find in the ambient pollution. However, in case of Delhi, this is not possible. The mix of sources in Delhi and its satellite cities is very diverse and the city is located such that the influence of the long range transport is often and large.
How do we conduct pollution based source attribution?
 Ideally, a large number of ambient samples must be collected from across the city from diverse locations (road, industrial, residential, and background), analyzed for chemical profiles, and then statistically matched with a set of source profiles (knowing which sources are likely to influence the ambient pollution), to establish the source shares. This is what we refer to as top-down source apportionment. This is an expensive route (from sampling to analysis), but also the most accurate route. (download an illustrated note on how to conduct source apportionment)
Second method is based on emission inventory, in its full spatial and temporal gridded form, for a representative urban airshed, processed through a dispersion model on top of a 3-dimensional meteorological field. With a series of such simulations, one can establish pollution based source attributions. This is what we refer to as bottom-up source apportionment. Except for the computational needs, this is relatively less expensive, with one main constraint – the emissions inventory must cover the influential urban airshed and account for long range transport (especially in case of Delhi).
Both the methodologies are important and needed, as they compliment each other, and drive us to understand the true shares of various sources. For example, diesel burnt in the trucks, cars, buses, and generator sets will produce very similar chemical profile, which will be hard to distinguish if there is no bottom-up understanding. Similarly, biomass burnt in the fields and in the cookstoves will produce very similar chemical profile, which will be hard to distinguish if there is no bottom-up understanding. There is a growing consensus for city’s emissions inventory, which builds our confidence in modeling pollution and source contributions.
In India, since 2000, we counted ~60 top-down source apportionment studies (through 2014), of which 70% are from 7 cities (Delhi, Chennai, Kolkata, Kanpur, Hyderabad, Raipur, and Mumbai) and Delhi takes the top spot with 20% of the overall studies. We summarized these in a journal article looking at the nature of air pollution in Indian cities.
What do we know?
We are summarizing four studies, 3 from ambient sampling based studies and 1 from dispersion modelling based study, which addressed source contributions to Delhi’s air quality. Irrespective of all the confusion in the media (primarily stemming from combining emissions and pollution studies) studies show similar source shares, which makes sense. For more details on each of the studies, follow the links to full report/paper or send an email to the contact person for the respective study.
STUDY (001) by CPCB (2010)
This was a multi-city study conducted for PM2.5 and PM10 samples, collected in year 2006-07. While the results from the PM2.5 samples were are not admissible (which blamed domestic LPG burning as a key urban pollution source), the results from PM10 samples made sense. We took the liberty of converting the PM10 shares into PM2.5 – assuming 15% of the dust in PM10 surviving in the PM2.5 fraction and 100% of all the other combustion sources surviving in the PM2.5 fraction. The pie graph below is an average of all samples reported in the CPCB (2010) study report.
STUDY (002) by IIT-Kanpur (2015)
 IIT Kanpur also conducted the CPCB (2010) study for Delhi and this 2015 study is considered an update, with new sample collection at six locations and two seasons (summer and winter). Contact person for the study details is Dr. Mukesh Sharma.
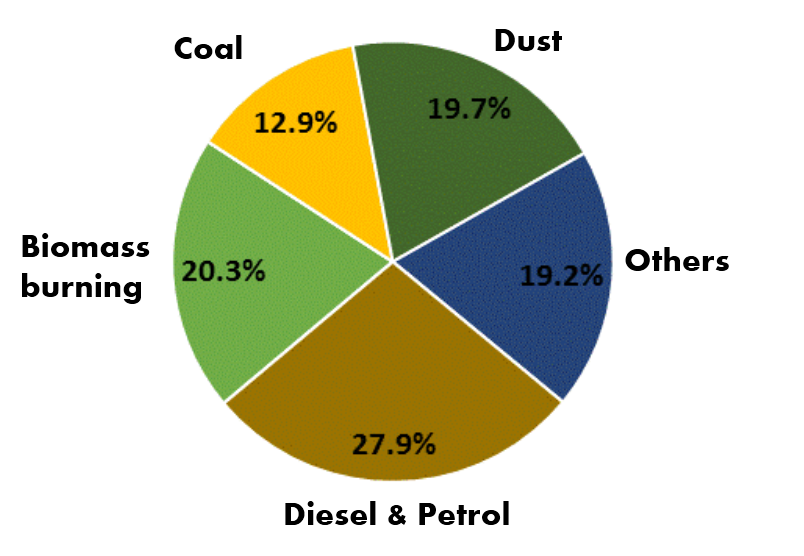
The source categories listed in this study were different from the STUDY (001). So, we took the liberty of clubbing them for simplicity. For example, the secondary sulfate aerosols, from the chemical conversion of SO2 emissions, are likely to originate from coal and diesel consumption. Similarly, nitrate aerosols, from the chemical conversion of NOx emissions, are likely to originate from coal, diesel, and petrol combustion. Clubbed all the construction, soil, and road dust into one dust category.
Since, the categories are listed along the fuel lines, we can interpret that all the diesel and petrol is linked to the vehicle exhaust and diesel generator sets; biomass burning can be linked to the crop residue burning (especially for the winter months) and biomass used for cooking and heating; coal could be consumed at industries, cooking, and heating.
STUDY (003) Georgia-Tech (2007)
 This is an older study conducted in four Indian cities for four seasons. Contact person for the study details is Dr. Zohir Chowdhury. Download the study report published in the Journal of Geophysical Research and a summary report by the World Bank.
For simplicity, we clubbed the fuel categories to match the study (001) and (002) pies and averaged all the results to represent annual shares. Since, the categories are listed along the fuel lines, we can interpret that all the diesel and petrol is linked to the vehicle exhaust and diesel generator sets; biomass burning can be linked to the crop residue burning (especially for the winter months) and biomass used for cooking and heating; coal could be consumed at industries, cooking, and heating.
STUDY (004) by UEinfo (2013)
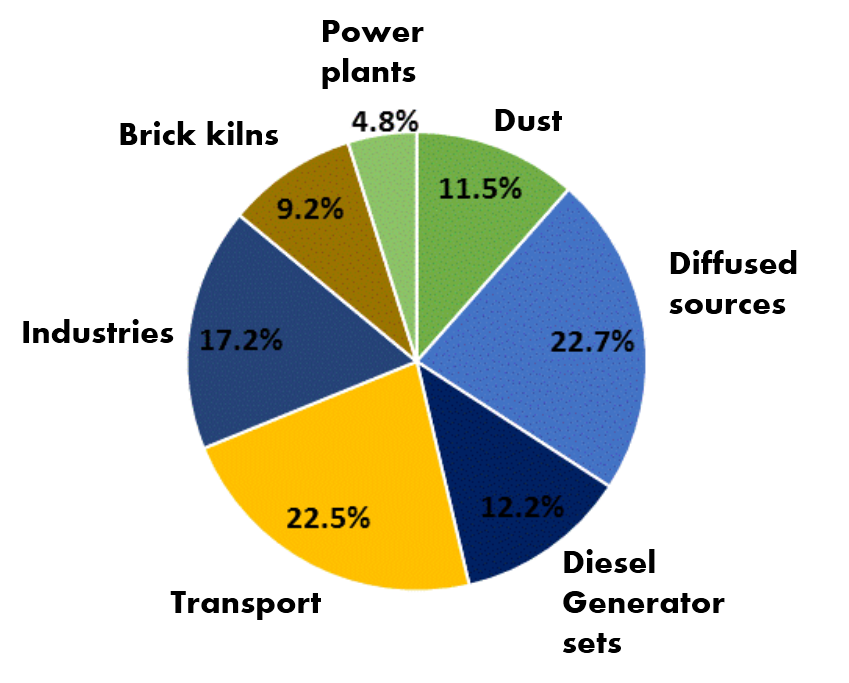 This is our bottom-up analysis study. The pie graph is an annual average based on emissions inventory and dispersion modelling, conducted at 1 km resolution for a working domain of 80 km x 80 km, including local sources like vehicle exhaust, dust re-suspension, cooking and heating, power plants, industries, brick kilns, open waste burning, and diesel generator sets, and contributions from outside the modeling domain (dust storms, open biomass fires, and fossil fuel burning in the immediate vicinity of the modeling domain). Multiple dispersion model simulations were conducted to ascertain these shares by month and season. Details of the emissions inventory (spatially and temporally segregated) and modeled source apportionment are published as two journal articles – Atmospheric Environment and Environmental Development.
An updated inventory is currently in use to model air quality forecasts over the National Capital Region; including particulate source apportionment on an hourly basis (updated everyday at 8PM, IST).
So, can we quantify pollution sources in Delhi?
This is not an easy question to answer, but the fact remains that we have an idea based on these ambient sampling and dispersion modelling based studies, and all of them point to a certain range.
On average, across the urban airshed of the Greater Delhi, to the annual average PM2.5 concentrations
- Vehicle exhaust is responsible for up to 30%
- Biomass burning (including seasonal open fires, cooking, and heating) is responsible for up to 20%
- Industries are responsible for up to 20%
- Soil and road dust is responsible for up to 15%
- Diesel generators are responsible for up to 15%
- Open waste burning is responsible for up to 15%
- Power plants are responsible for up to 5%
- Outside the urban airshed is responsible for up to 20%
(sum is not 100% – this is an upper estimate for all the sources)
Resource material
- Delhi Air Quality Information
- Delhi Dialogue Commission
- Indian Institute of Tropical Meteorology, SAFAR program for Delhi
- Delhi Pollution Control Committee
- Nature of air pollution and emission sources in Indian cities (Atmospheric Environment, 2014)
- Health impacts of air pollution in Delhi (Environmental Development, 2013)
- A GIS based emissions inventory for Delhi (Atmospheric Environment, 2013)
- Critical review of receptor modeling in India (Atmospheric Environment, 2012)
- Particulate pollution source apportionment (CPCB, 2010)
- A call for open air pollution information (UEinfo, 2016)
- What’s eating Delhi’s air quality – emissions or meteorology?
- Why do we need to model air pollution?
- Benefits of restricting private vehicle usage
- How many buses are needed to support Delhi’s public transport?
- Evolution of the on-road transport emissions in Delhi
- Benefits of banning older vehicles on Delhi’s air quality