 March, 2016: Delhi announced to repeat the odd/even experiment from April 15th to 30th, 2016. Last time the experiment was conducted for two weeks between January 1st and 15th, 2016. The pilot was a social success, based on the reactions posted on the social media and printed in the other media. However, accordingly to CPCB, IITM, and TERI, the benefits of the program on the day time air quality was not immediately apparent in the ambient measurements, with likely large interference from meteorology. A difference in difference analysis comparing ambient PM2.5 data between Delhi stations and non-Delhi stations showed 10-13% drop in the day time concentrations.
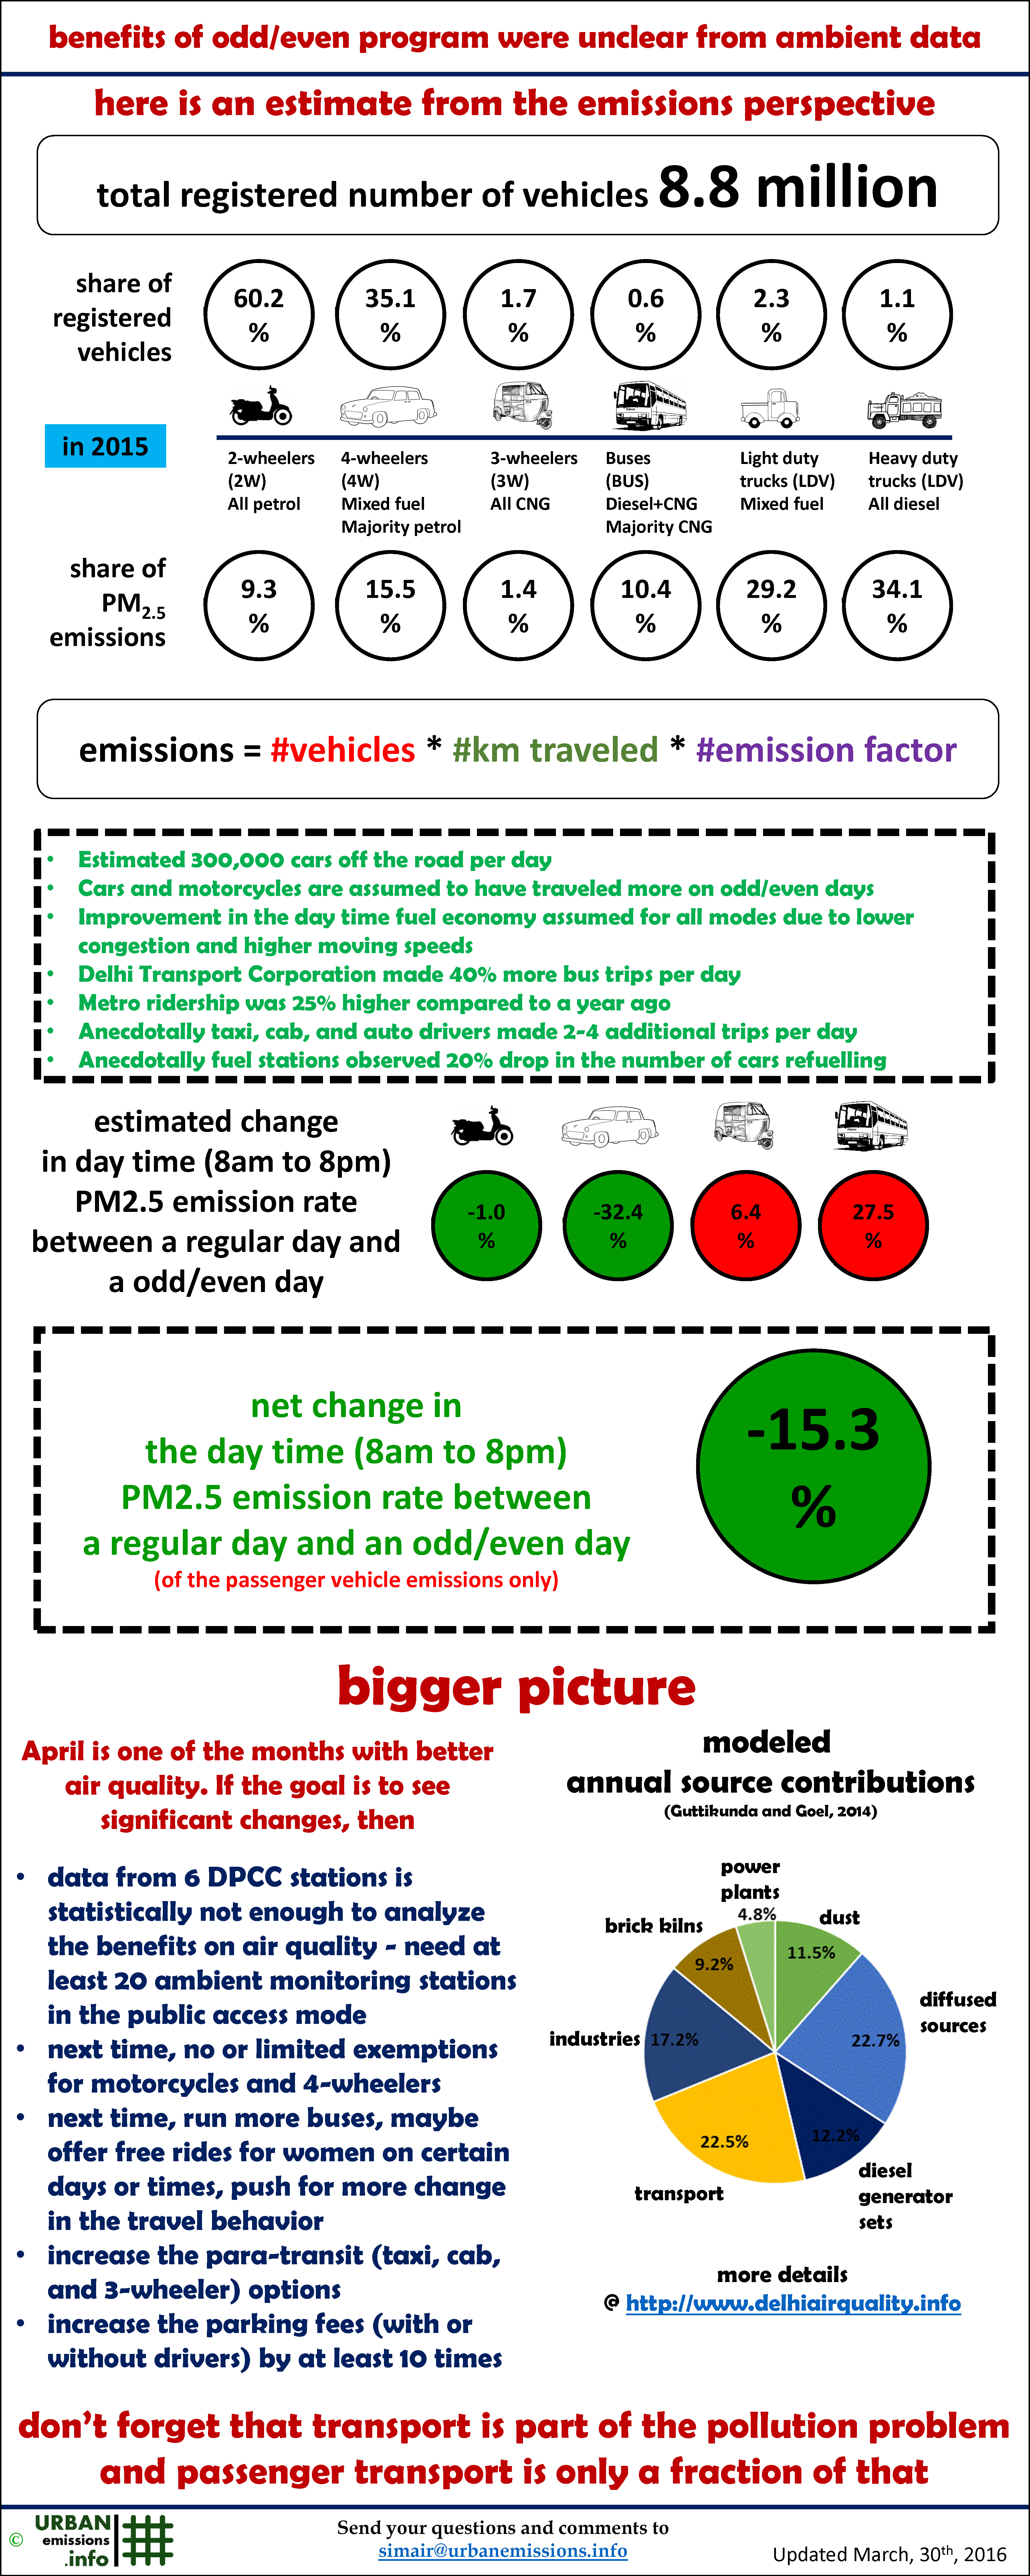
In December, 2015, we released an infographic on possible benefits of restricting the on-road vehicles during the day time. Below is an emissions analysis comparing the emission rates from the passenger vehicles during a regular day and an odd/even day, based on what we understood has transpired during the two weeks of January, 2016.
Based on the monthly and seasonal air quality trends, April is one of the months with better air quality, compared to January. Question – do we need to repeat the experiment to know what is good for us, again? We will stick with our assessment on the need for an additional 15,000 buses in the city, to support a safe, comfortable, and reliable public transportation system, which will eliminate any need for such experiments.

Download the infograph as a PDF or a GIF
Other infographics on Delhi’s air quality and transport
- What’s eating Delhi’s air quality – emissions or meteorology?
- Benefits of restricting private vehicle usage
- How many buses are needed to support Delhi’s public transport?
- Evolution of the on-road transport emissions in Delhi
- Benefits of banning older vehicles on Delhi’s air quality
Mail your questions to simair@urbanemissions.info
